Optimus Dashboard
When you run docker-compose up optimus will deploy optimus-dashboard on http://localhost:9909.
Use these creds to login u: admin, p: C0mplexPwd
The Optimus dashboard was built keeping in mind all the pain points of mobile automation and challenges in debugging a failed scenario.
The Optimus dashboard has below key features
- Build Summary
- Builds History
- Feature Report
- Device Report
- Test Case Growth
- Alerts
- Crashes
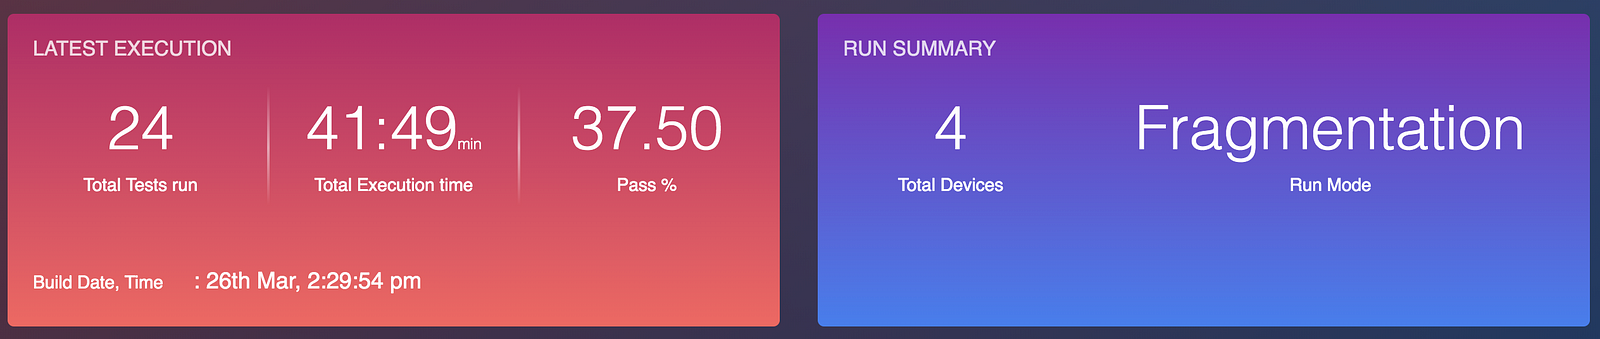
Build Summary
You can view the latest build summary in this section along with the type of run; distribution, fragmentation.
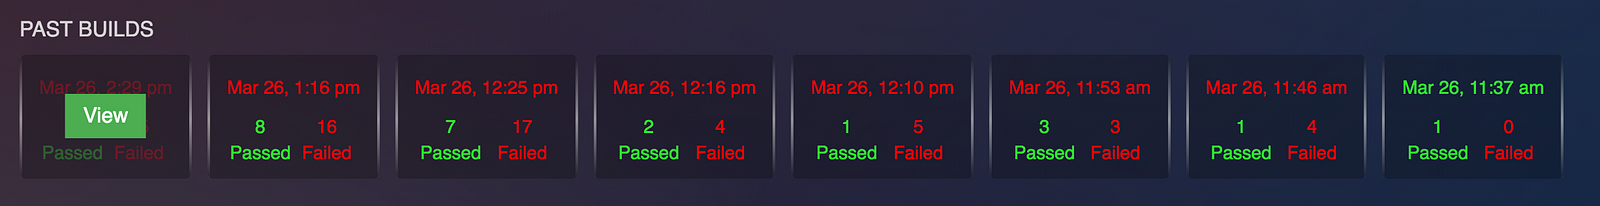
Builds History
Optimus Dashboard displays 20 builds at a time. In the fast-paced agile world, builds older than 1–2 weeks hardly add any value.
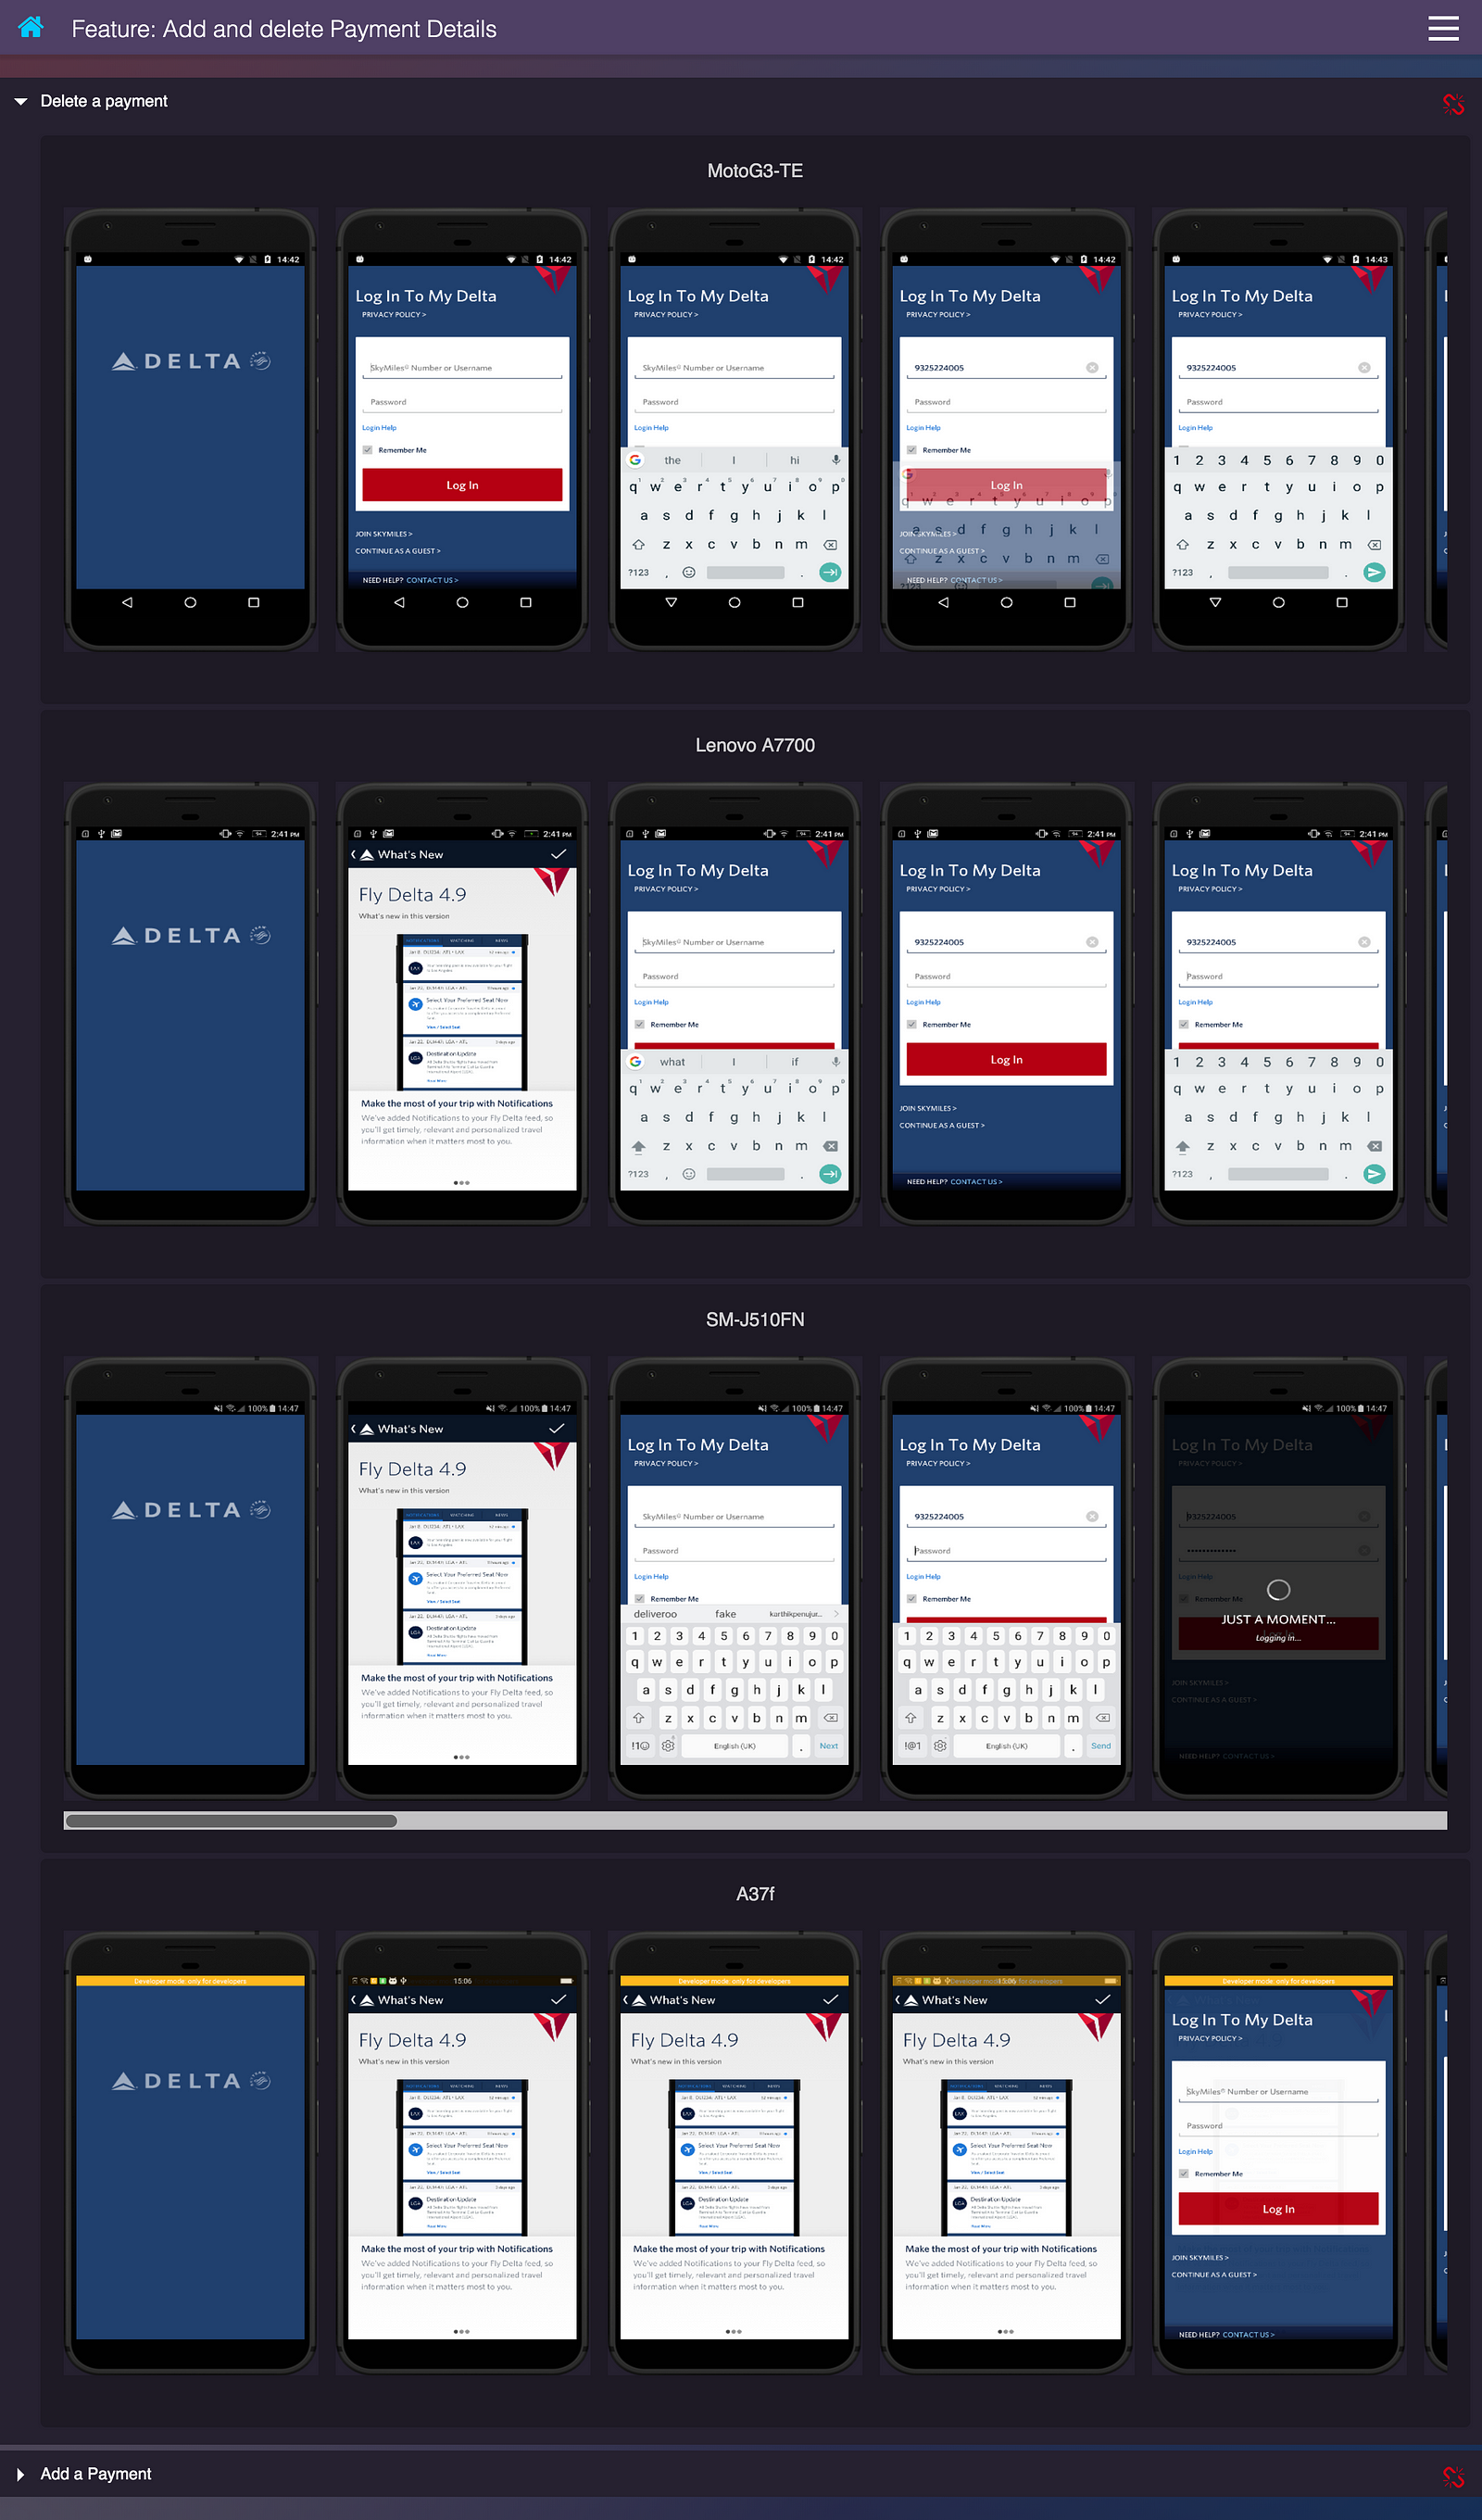
Feature Report
This section is a typical functional report that provides an overview of a number of features ran and their status.
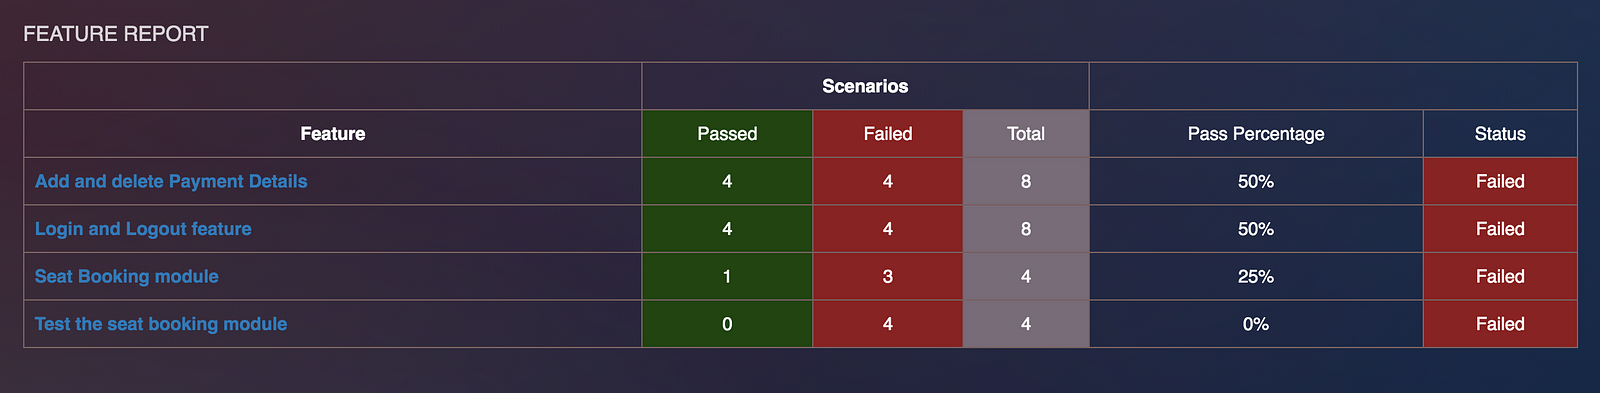
It's just not it, once you click on a feature, you could get a detailed timeline of those feature scenarios.
Device Report
Device report outlines the status of scenarios run on a particular device. This report helps us in identifying the devices that cause trouble or incompatible.
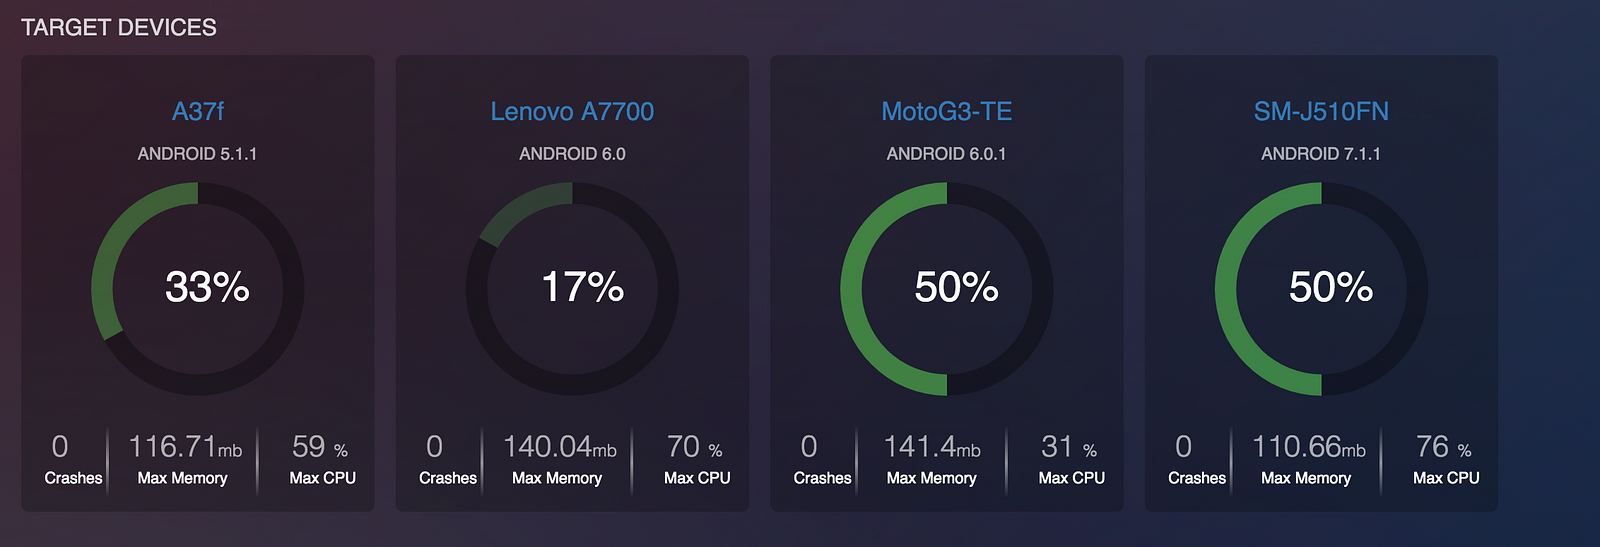
It also outlines the max memory, CPU usage and crashes (if any) on a particular device. Once you click on a particular report, you will be navigated to Device Detail Report
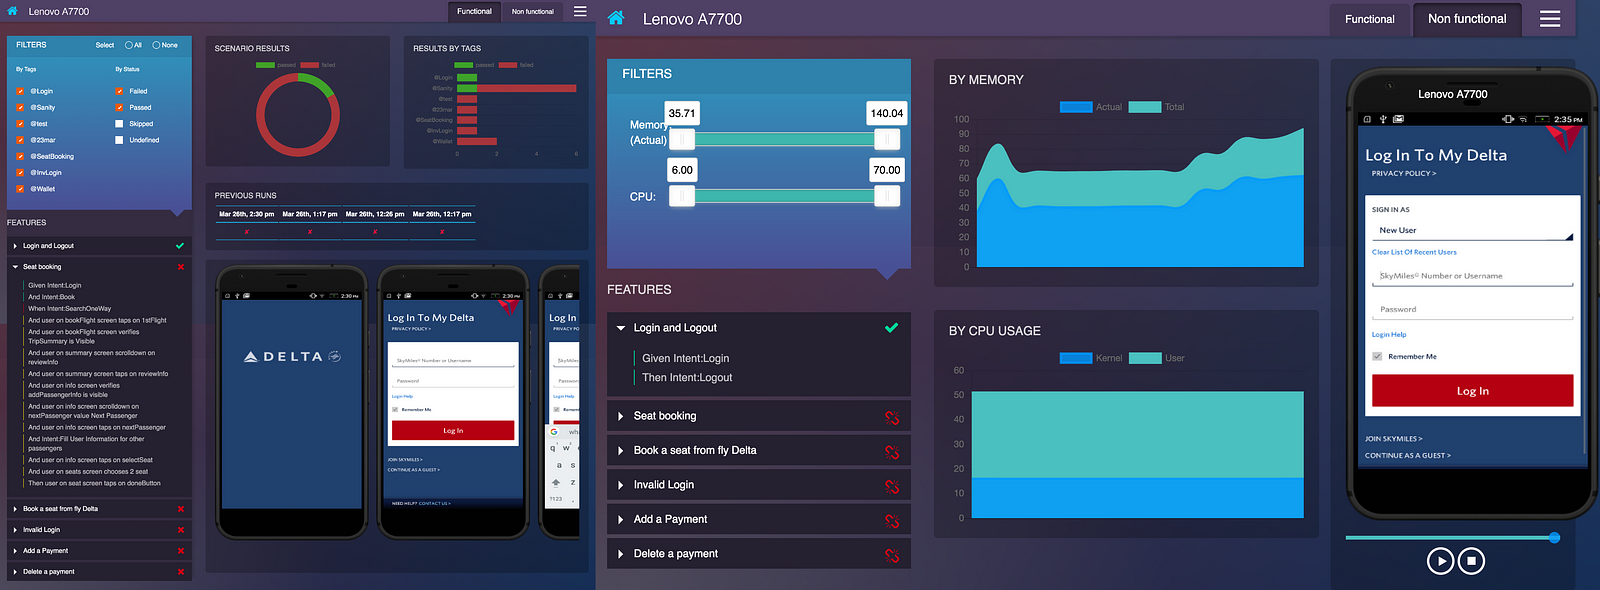
The device detail report has two views
- Functional
- Non-Functional
Functional View
This view details the scenarios that run on that particular device and the status of each step. It allows shows the history of that scenario over 5 builds.
Non-Functional View
In the non-functional view, you could identify which activity is causing a spike in CPU and memory.
Test Case Growth
This report outlines the number of scenarios being added over a period of time to its stability.
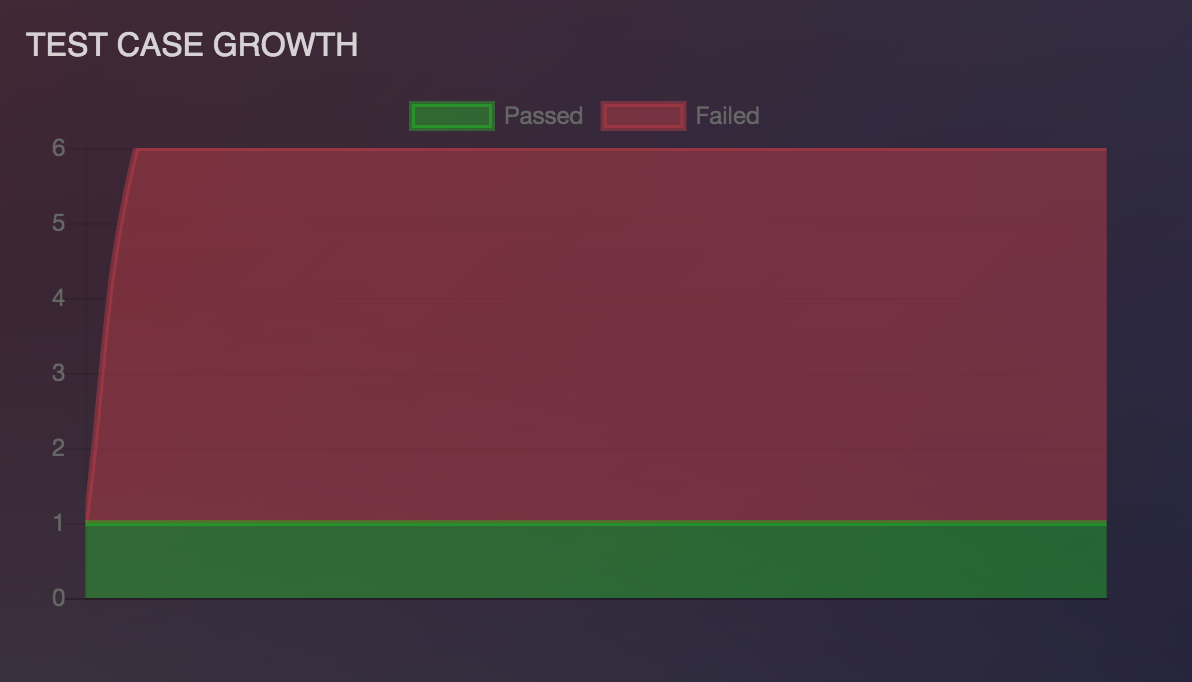
Say you have 50 scenarios in your regression and the regression stability is around 99%. Your team has added another 10 scenarios this week and the stability came down to 90 %, the test case growth view helps in analysing which chunk of scenarios is reducing your build stability.
Alerts
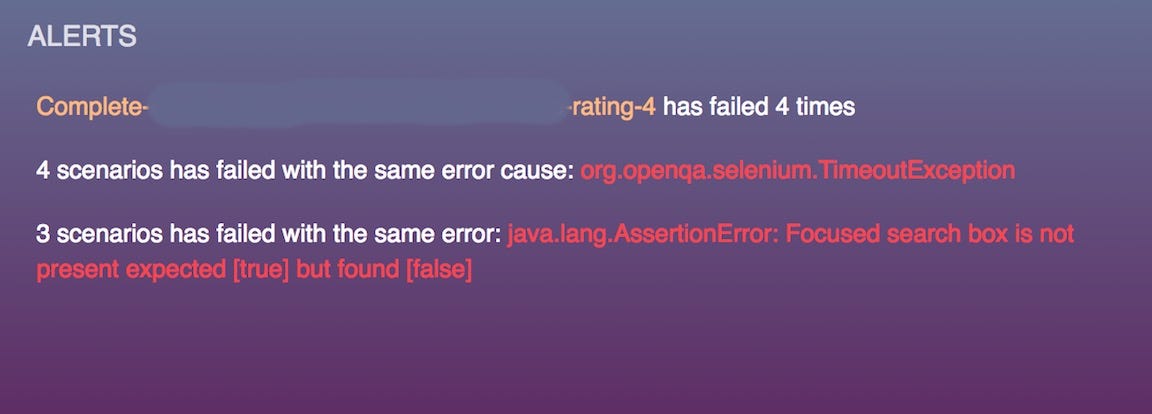
Alerts view summarises last build's failures to help in easy analysis when the build stability decreases dramatically.
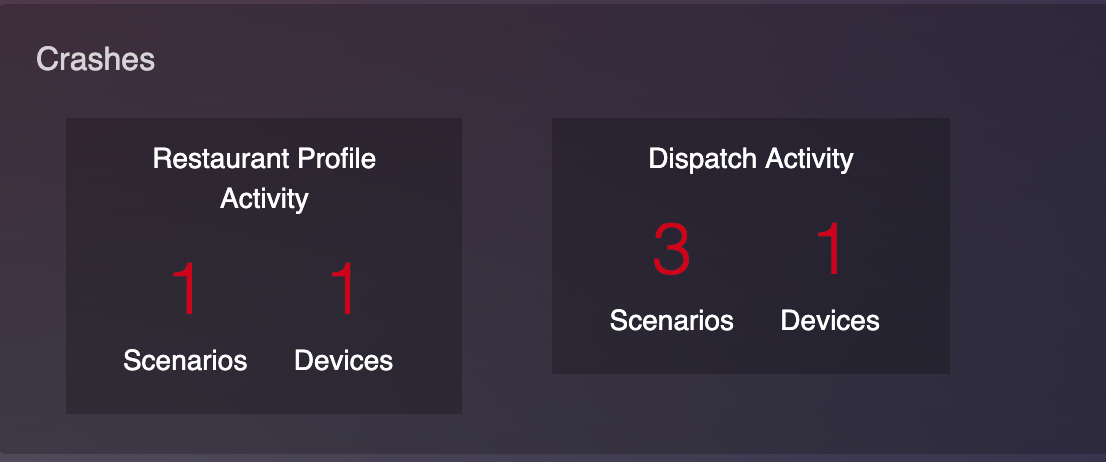
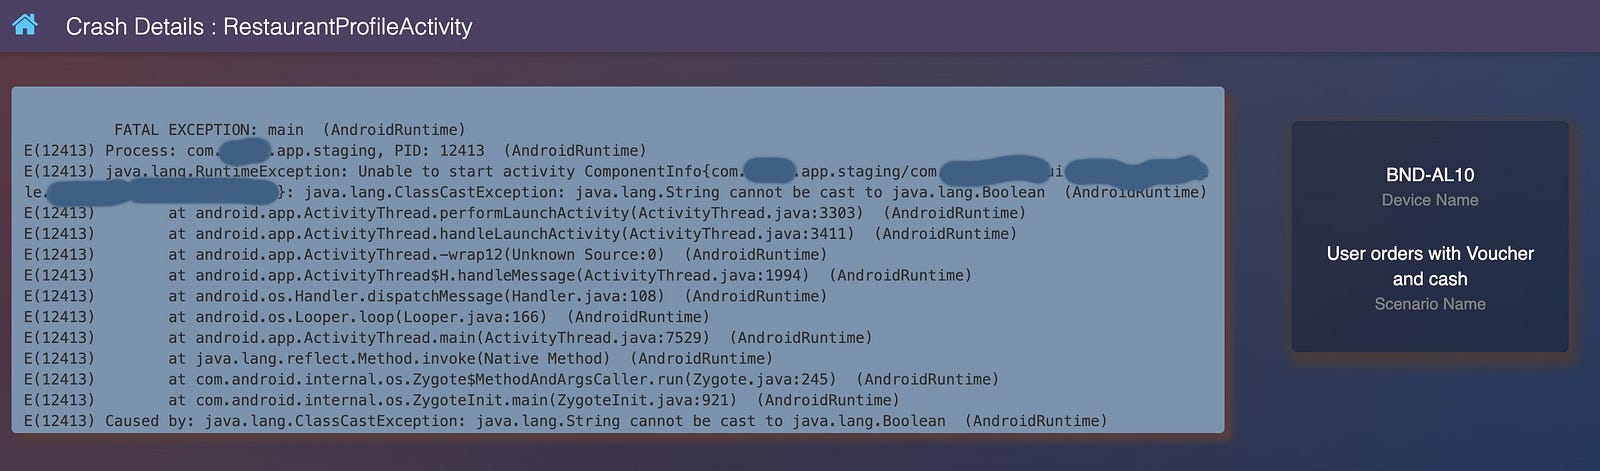
Crashes
Crashes view displays the crash of a particular activity.